Don’t put all your eggs in one basket is the basic principle behind creating diversified investment portfolios. While the right thing to do, some investors are disappointed when they see how their overall portfolio is doing when compared to the best performers in their diversified basket.
By investing in a variety of asset classes, such as stocks, bonds, and commodities, most people hope to earn a reasonable return over time and avoid sharp swings in the value of their portfolio. How investors allocate their investments across different asset class should be based on what they plan to use the money for, when they anticipate drawing down their investment account, and their tolerance for risk. Sound advice.
But after investing the money, it is human nature to compare what was earned on the overall portfolio with what each asset class has returned. Because the portfolio will always do worse than the best performing asset class in the portfolio, people prone to ‘coulda, woulda, shoulda’ may be tempted to market-time their investments. For example, they may reallocate money to the top performing asset class in the belief that short-term movements are a good predictor of longer-term performance. But chasing investment opportunities based purely on gazing in the rear-view mirror is the opposite of what investors should do. We’ve all seen the disclaimer ‘Past performance does not guarantee future returns.’
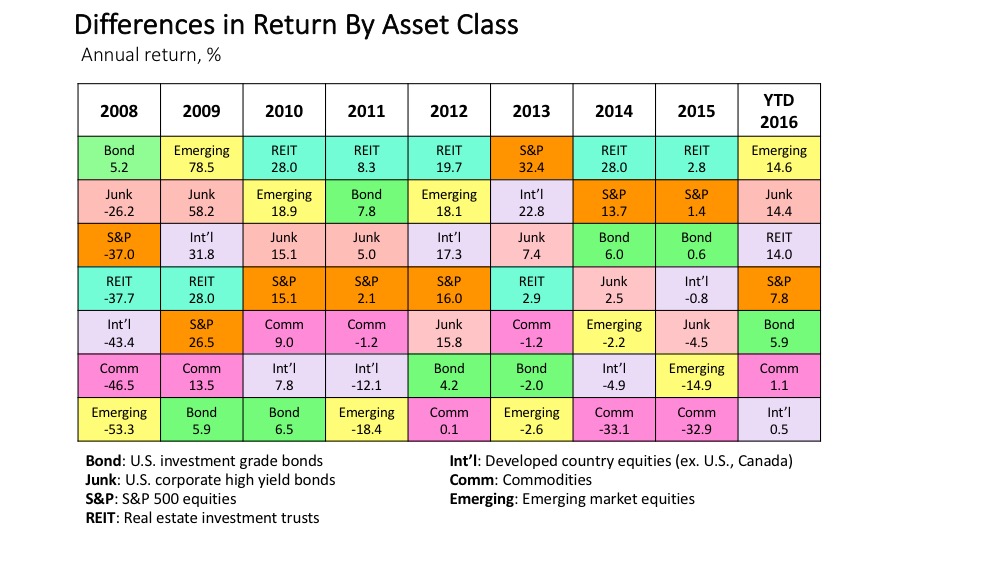
How much difference is there year to year in returns by asset class? Minerva Wealth Advisory recently completed a study to measure annual returns across 7 different asset classes since the 2008 financial crisis. The results of the study, summarized in the exhibit below, show just how volatile financial markets can be.
Annual returns by asset class are shown in each column, with the best performing asset class that year at the top, with the other asset classes in descending order. In 2008, for example, investment grade bonds were the best performing asset class, returning 5.2 percent, followed by junk bond investments at -26.2 percent, the S&P 500 at -37.0 percent, all the way to the bottom of the list with emerging market equities returning -53.3 percent. But in 2009, what was at the top of the list in 2008 – investment grade bonds – was now at the bottom of the list. The crazy quilt of colors gives a sense for volatility that occurs year to year in financial markets.
How do returns on a diversified portfolio compare with returns by asset classes? One simple diversified portfolio would be to invest 60 percent in the S&P 500 and 40 percent in investment grade bonds. The black line in the chart below shows how this portfolio performed over time relative to the 7 asset classes; the number at the bottom of each column shows the return on the diversified portfolio. While a very simple portfolio, it shows how diversification can help reduce volatility over time.
How much diversification should an investors have in a portfolio? There is no single answer, because it depends on what they want to do with the money and their time horizon. For example, if they have a 20-year time horizon because the money is going to be used in retirement, then it may make sense to consider diversified portfolios tilted to higher return/higher risk investments. But if their time horizon is 3 years because they plan to use the money to pay college bills, they may want to consider portfolios concentrated in short-term fixed income instruments.
Note: The following indexes were used to perform the analysis: investment grade bonds (Barclays US Aggregate Bond index), high yield bonds (Barclays US Corporate High Yield Bond index), emerging market equity (MSCI Emerging Markets index), international equities excluding the US (MSCI EAFE index), REITs (FTSE NAREIT All Equity REITs index), commodities (S&P GSCI index), S&P 500 (S&P 500 index). The YTD 2016 numbers are based on data through the middle of September.
DISCLAIMER: This information is not intended to provide legal or accounting advice, or to address specific situations. Please consult with your legal or tax advisor to supplement and verify what you learn here. This is presented for informational or educational purposes only and does not constitute a recommendation to buy/sell any security investment or other product, nor is this an offer or a solicitation of an offer to buy/sell any security investment or other product. Any opinion or estimate constitutes that of the writer only, and is subject to change without notice. The above may contain information obtained from sources believed to be reliable. No guarantees are made about the accuracy or completeness of information provided. Past performance is no guarantee of future results.


