Booms And Busts In The Economy Explained To Everyone

http://www.advisor.ca/wp-content/uploads/2011/08/economy_puzzle.jpg

Many people are confused about how the US economy works.  While they may have taken an economics class in high school or college, it wasn’t much fun or practical. When they listen to politicians and pundits talk about the economy, it only adds to their confusion.

I was happy to discover recently a terrific video that clearly and concisely explains how borrowing creates cycles in economic activity. The video was created by Ray Dalio, the founder and CEO of Bridgewater Associates. While most people have heard of Warren Buffett, there are two titans in the world of investing: Ray Dalio and Warren Buffett. They each came from humble backgrounds and went on to create extraordinarily successful investment management companies. 

Dalio created the video to share his views with as large an audience as possible about how the economy works. Nothing as important as the economy can be explained in a typical 90 second YouTube video. But Dalio’s 30-minute animated video is worth the investment of time.


DISCLAIMER:  This information is not intended to provide legal or accounting advice, or to address specific situations. Please consult with your legal or tax advisor to supplement and verify what you learn here. This is presented for informational or educational purposes only and does not constitute a recommendation to buy/sell any security investment or other product, nor is this an offer or a solicitation of an offer to buy/sell any security investment or other product. Any opinion or estimate constitutes that of the writer only, and is subject to change without notice. The above may contain information obtained from sources believed to be reliable. No guarantees are made about the accuracy or completeness of information provided. Past performance is no guarantee of future results. 

Staring Down Stock Market Volatility

After an especially profitable year for most investors, stock market volatility came thundering back in the first quarter of 2018.  After peaking on January 26, the S&P 500 index fell 10.1 percent over two weeks, popped back up 8.2 percent over the following four weeks, and then continued to fluctuate dramatically. As of May 3rd, it was down a modest 1.6 percent of the year. S&P 500 volatility of this magnitude has not occurred for almost two years. The long period of quiescence led many investors to forget what market setbacks look like.

The relative calm of 2016 and 2017

While the Presidential election and Trump’s first year garnered headlines, investors worldwide were buoyed by three fundamental factors. First, economic growth was strong, often beating economists’ projections. Second, inflation remained tame, with many of its forward indicators undershooting expectations. Lastly, monetary policy remained steady with many central banks keeping short-term interest rates low. A common method of valuing financial assets is to discount future cash flows. Low rates engineered by central banks, which help keep discount rates low, combined with strong economic growth and corporate earnings, and lower than expected inflation, helped push up equity prices and kept volatility at bay.

What is behind higher 2018 volatility

Higher first quarter volatility was initially triggered by new government data released in February showing building inflationary pressures. This led to concern that central banks may be forced to push interest rates up faster than expected, which could mean higher investor discount rates and lower share prices. The growth outlook also became uncertain due to concerns about the threat of trade wars following President Trump's proposals for increases in tariffs on aluminum and steel. The prospect of higher interest rates also raised concerns that highly leveraged companies may have taken on more risk than they could handle. In the pithy words of Warren Buffett, “Only when the tide goes out do you discover who has been swimming naked.” For all these reasons, investors’ views on owning stocks became less rooted and equity markets became more volatile.     

Getting used to volatility

Most investors understand that bonds are riskier than cash and that equities are riskier than bonds. But over long periods of time, the market tends to reward risk takers with higher returns. The willingness to endure volatility like what we had in the first quarter is essential to capturing the market returns available to long-term investors.


Dalya Inhaber, Ph.D., CFP ® is a financial advisor based in New York. She is the founder of Minerva Wealth Advisory, a Registered Investment Advisory firm. The mission of the company is to provide clients with tailored and unbiased financial planning and investment management. Dalya holds a Ph.D. in economics and statistics from the University of Michigan. The firm is named after Minerva - the Roman goddess of wisdom and knowledge. Minerva is often depicted with her sacred creature the owl, whose keen eyesight helps her navigate a path forward.


What I Learned Freezing My Credit

Experian Credit Freeze

In the aftermath of the Equifax data breach, which could impact up to 143 million individuals, it is important to monitor your credit reports and either freeze your credit, sign up for fraud alerts, or register for credit monitoring services. Of these, only freezing your credit (also called a security freeze) can help prevent someone from obtaining credit in your name.  If you do not anticipate applying for a credit card or loan in the near future, freezing your credit is the best way to protect yourself.  
 
Yesterday I attempted to place a credit freeze online with the three major credit reporting agencies: Equifax, Experian and TransUnion. I succeeded only with TransUnion. I now have a PIN number that will allow me to ‘unfreeze’ my report when I next apply for credit. On the Equifax website, I received an ‘Error 500’ message after entering a great deal of information. On the Experian website, I got as far as clicking, ‘Add a security freeze’ and then ‘Apply online’ before a page failed to load. For these two agencies, I was successful in placing a security freeze by phone.
 
Equifax, where the breach occurred, is offering a monitoring service that will be free for one year. It's called TrustedID Premier. There was a great deal of controversy last week over its terms of use, which required subscribers to give up their right to sue Equifax. Equifax has since posted the following statement on their website:

“We’ve added an FAQ to our website to confirm that enrolling in the free credit file monitoring and identity theft protection that we are offering as part of this cybersecurity incident does not waive any rights to take legal action. We removed that language from the Terms of Use on the website, www.equifaxsecurity2017.com. The Terms of Use on www.equifax.com do not apply to the TrustedID Premier product being offered to consumers as a result of the cybersecurity incident.”
 
If you are interested in a credit freeze, these are the websites and phone numbers to use:
Equifax  1-800.349.9960 - www.freeze.equifax.com
Experian 1-888.397.3742 - https://www.experian.com/freeze/center.html
TransUnion 1-888.909.8872 - https://www.transunion.com/credit-freeze/place-credit-freeze
For additional information, a good resource is the Federal Trade Commission website, https://www.consumer.ftc.gov/blog/2017/09/equifax-data-breach-what-do. 


DISCLAIMER:  This information is not intended to provide legal or accounting advice, or to address specific situations. Please consult with your legal or tax advisor to supplement and verify what you learn here. This is presented for informational or educational purposes only and does not constitute a recommendation to buy/sell any security investment or other product, nor is this an offer or a solicitation of an offer to buy/sell any security investment or other product. Any opinion or estimate constitutes that of the writer only, and is subject to change without notice. The above may contain information obtained from sources believed to be reliable. No guarantees are made about the accuracy or completeness of information provided. Past performance is no guarantee of future results. 

What Happened To Interest Rates Since The November Election?

Interest Rates Since The November Election

The simple answer: interest rates have mostly increased.  The 10-year Treasury rate is the most commonly used benchmark for interest rates. As shown below, the 10-year Treasury bond yield was 2.23% in the middle of May, up from 1.84% at the end of October. On the short end of the yield curve, the 2-year Treasury rate was 1.28% in mid-May, up from .86% at the end of October. Since interest rates and bond prices are inversely related, bond investors have seen losses in their bond portfolios.

Interest Rates Since The November Election?

Even though short and long rates have generally increased since the election, the 2-year rate has yet to peak, while the 10-year rate has been declining since mid-March.  What does this mean? Before we delve into that, we need to understand the relationship between short and long-term rates.

The relationship between yields of the same credit quality at different maturities is called the yield curve. The shape of the yield curve is often interpreted as a reflection of investor sentiment in both the bond and stock markets. Most of time, the yield curve slopes upward: long rates are higher than short rates. This is typically the case because bond investors making a long-term commitment take on more risk and need to be compensated for it by receiving higher interest rates.

Over the past 2 months, the yield curve has flattened somewhat, as shown below.  What is especially noteworthy is that short rates have increased during this period, while long rates have decreased.

Treasury yield after presidential election by minerva

Short term interest rates are affected by Federal Reserve policy and market forces. The Fed increased the target Federal Funds rate by .25% in mid-December and again in mid-March (the Federal Funds rate is the rate banks charge each other for overnight lending), which is the principal reason why short rates rose. But Fed policy tends to have far less impact long term interest rates, which is why many market analysts view long-term interest rates as a purer reflection of long-term investor sentiment. Declining long term interest rates are generally considered an indication that investors have lowered their expectations for future interest rates. This is often associated with slower economic growth and inflation. Some commentators have taken this a step further and interpreted a flattening yield curve as a predictor of “re-pricing of risk”, meaning a potential correction in the stock market and other risky assets.


DISCLAIMER:  This information is not intended to provide legal or accounting advice, or to address specific situations. Please consult with your legal or tax advisor to supplement and verify what you learn here. This is presented for informational or educational purposes only and does not constitute a recommendation to buy/sell any security investment or other product, nor is this an offer or a solicitation of an offer to buy/sell any security investment or other product. Any opinion or estimate constitutes that of the writer only, and is subject to change without notice. The above may contain information obtained from sources believed to be reliable. No guarantees are made about the accuracy or completeness of information provided. Past performance is no guarantee of future results. 


Interest Income May Be Lower Than It Appears

Charles Ray, Puzzle Bottle. 1995. Glass, painted wood.

Charles Ray, Puzzle Bottle. 1995. Glass, painted wood.

Despite the recent increases in interest rates, many investors are still reaching for income in the current low interest rate environment. When interest rates are low, it is common for the coupon payments an investor receives to overstate their actual bond return. For example, when you see that your portfolio includes a 10-year bond with a 5% coupon, while the 10-year Treasury yield is 2.4%, is it time to congratulate your advisor on her brilliance in finding income for you?

Before we answer that question, let’s take a closer look at your brokerage account statement. If you see that the cost of this bond is over 100, then your advisor bought what is called a “premium bond”. A premium bond is a bond for which you paid more than its face value. For example, if your statement indicates a cost of 110.5, then you paid $1,105 for a bond for which you will receive $1,000 at maturity. That means that your “current yield” (defined as the 5% coupon payment divided by the price paid for the bond) is 4.5%, not 5%. The higher the premium paid for the bond and the closer the maturity date, the lower the actual yield earned on it and the more misleading it is to look at the coupon alone.

Now let’s look at the estimated income figure on your statement. It is typically in the far right column of the fixed income section of your statement. The estimated income figure is simply the coupon payment, which in this example, would be $50 per bond. If you use all this income for living expenses, you are depleting your principal. That is because part of that income is the return of the premium you already paid and that you will not get back at maturity.

Should you avoid premium bonds? No. But you should be aware that the return on this investment is lower than it appears. The interest income you are receiving is really both the return you are earning and a return of the premium you paid. To be certain you are not pulling too much out of your bond portfolio, withdraw only the portion equal to your yield to maturity when you bought the bond.[1]


[1] The yield calculation is more complicated for callable bonds.


DISCLAIMER:  This information is not intended to provide legal or accounting advice, or to address specific situations. Please consult with your legal or tax advisor to supplement and verify what you learn here. This is presented for informational or educational purposes only and does not constitute a recommendation to buy/sell any security investment or other product, nor is this an offer or a solicitation of an offer to buy/sell any security investment or other product. Any opinion or estimate constitutes that of the writer only, and is subject to change without notice. The above may contain information obtained from sources believed to be reliable. No guarantees are made about the accuracy or completeness of information provided. Past performance is no guarantee of future results. 

The Long-Term Shift Toward More Educated Workers

The Center on Education and the Workforce at Georgetown University recently released a report showing how the long-term growth in the demand for a highly skilled workforce is translating into divergent rates of job growth for workers with different education levels.

They report that “As factories and mines have closed and office and administrative support functions have been automated, men and women without a college education — who were previously able to build a middle-class life and raise a family — found themselves out of a job, often for prolonged periods of time and, in some cases, even detached from the labor force. Those who were lucky enough to find another job after being laid off or displaced often did so at a price — lower wages, which often take decades to rebuild to their pre-displacement levels.”

Some surprising statistics from their report:

The Long-Term Shift toward More Educated Workers
The Long-Term Shift toward More Educated Workers by Minerva Financial Advisory

Source: Georgetown University Center on Education and the Workforce, America’s Divided Recovery: College Haves and Have-Nots, June 30, 2016. Employment includes all workers age 18 and older.


DISCLAIMER:  This information is not intended to provide legal or accounting advice, or to address specific situations. Please consult with your legal or tax advisor to supplement and verify what you learn here. This is presented for informational or educational purposes only and does not constitute a recommendation to buy/sell any security investment or other product, nor is this an offer or a solicitation of an offer to buy/sell any security investment or other product. Any opinion or estimate constitutes that of the writer only, and is subject to change without notice. The above may contain information obtained from sources believed to be reliable. No guarantees are made about the accuracy or completeness of information provided. Past performance is no guarantee of future results. 

Minimizing Capital Gains Taxes During An Extended Bull Run

The extended bull run in the U.S. stock market has put smiles on many investors faces. The popular S&P 500 stock index is up 101 percent since the start of 2010 while the NASDAQ stock index gained 144 percent over the same period. But when investors elect to sell, Federal and State taxes can take a substantial bite out investment returns, turning smiles to frowns. Investors need to be alert to actions they can take to keep capital gains taxes as low as possible.

Refresh my memory, how does the IRS define capital gains? When the value of an asset, such as an individual stock or mutual fund, is higher than what the investor paid for it, the difference is the capital gain. The gain is not realized until the asset is sold. When sold, the capital gain is classified as either short-term (meaning the asset was held for one year or less) or long-term (held for more than one year). The investor must include realized gains, netted against realized capital losses, in their income tax return and pay any associated capital gains taxes.

How will capital gains be taxed in 2017? Investors need to be aware of three different Federal taxes: short-term capital gains taxes, long-term capital gains taxes, and the Medicare contribution tax on net investment income. In addition, depending on where the investor lives, they may also be liable for additional state-based capital gains or income taxes.

Short-term capital gains are treated as ordinary income by the Federal government. So how much tax the investor pays will depend on how much ordinary income they report on their Federal income tax return. The short-term capital gains tax rate can be as low as zero percent and as high as 39.6 percent (see table).

minimizing capital gains according to Minerva Wealth Advisory

Long-term capital gains generally fall into one of three tax brackets: 0%, 15%, and 20%, which for most investors is less than the tax they would pay on ordinary income. Because of the preferential treatment of long-term capital gains, investors should make every effort to hold an investment for more than one year (at least one year plus a day) so they can enjoy this important tax benefit. Whether they pay 0%, 15%, or 20% depends on how much ordinary income they earn in the year in which they realize the long-term capital gains (see table).

federal tax rate 2017 Minerva Wealth Advisory

In addition to Federal short-term and long-term capital gains taxes, investors with incomes above a threshold must also pay the Net Investment Income Tax, which went into effect on Jan. 1, 2013 as part of the Affordable Care Act. High-income taxpayers are subject to a 3.8% Medicare contribution tax on net investment income, which includes gains from the sale of stocks, bonds, and mutual funds. For example, married couples filing jointly with more than $250,000 of ordinary income, must pay this additional tax on realized capital gains. Suppose this couple also had $10,000 of realized long-term capital gains. Referencing the tables above, the couple would be in the 33% tax bracket for purposes of ordinary income and 18.8% for long-term capital gains (the 15% capital gains tax rate plus the 3.8% net investment income tax rate).

But the capital gains tax bill may not stop there, depending on where the investor lives. If a New York State resident, they could be liable for an additional 8.8 percent capital gains tax because capital gains are treated as ordinary income. It is also important to remember that unlike wages, federal and state taxes are not automatically withheld from capital gains proceeds. If an investor has significant realized gains, then they should consult with their financial and tax advisors to make estimated tax payments, so they do not incur IRS penalties.    

What strategies can investors follow to minimize capital gains taxes? There are 5 strategies that investors should be aware of, from simple techniques to those that require more planning.

1. Wait at least a year and a day. For capital gains to qualify for long-term status and a lower tax rate, wait at least a year and a day before selling an investment. The tax rate the investor will pay on the gain will be between 10 and 20 percentage points lower than the short-term capital gains tax rate, depending on the amount of ordinary income they earn.

2. Time capital gains with capital losses. The IRS permits taxpayers to offset realized capital gains with realized capital losses. For example, if an investor realized $40,000 of long-term capital gains but also realized $25,000 capital losses, then for tax purposes, their net gain is only $15,000.

3. Sell when your income is low. Taxpayers in the 10% and 15% income tax brackets escape having to pay long-term capital gains taxes. If an investor’s income is particularly low one year, that may be a great time to realize some long-term gains. For example, based on the tables above, a married couple with ordinary income of $60,000 is in the 15% income tax bracket, but the 0% long-term capital gains tax bracket.  

4. Consider gifting appreciated assets to children. The IRS permits taxpayers to gift up to $14,000 per year, without incurring any gift taxes. If the person receiving the gift is in a lower income tax bracket than the gifter and elects to sell the investment, then they will be able to pay lower capital gains taxes. For example, suppose a married couple each gift $12,000 of securities to their 10-year-old child, with each gift having $6,000 of embedded long-term capital gains. The total value of the gift is $24,000, with $12,000 of it characterized as long-term capital gains. Because the gift is below the threshold level, the parents do not have to pay any gift taxes. Moreover, because the child is likely in the 10% or 15% income tax bracket, they will likely incur no capital gains tax when the securities are sold. But if their parents had sold the securities rather than gifting them, they would have been liable for capital gains taxes.

5. Consider holding appreciated assets so an investor’s heirs benefit from a step-up in basis. Tax laws are notoriously complex. But there is an important wrinkle associated with estate taxes that creates an important tax planning tool to minimize capital gains taxes. When someone dies, the IRS permits assets owned by the deceased to pass to their heirs at the then current market value, without being liable for any capital gains taxes. The original cost basis gets wiped out entirely. For example, suppose many years ago, an investor purchased $100,000 of an S&P 500 index fund that is now worth $300,000. If she elected to sell the index fund during her lifetime, the $200,000 of gain would be subject to capital gains taxes. But if instead the investor held the index fund until she passed away, it would pass to her heirs at $300,000, with no capital gains being due on the transfer. This step-up in basis is a huge advantage that can dramatically influence decisions on when to sell appreciated securities.


NOTE: Nothing in this post should be considered as rendering legal or tax advice for specific cases. Readers should be sure to discuss their specific circumstances with their financial and tax advisors before taking any action. 


DISCLAIMER:  This information is not intended to provide legal or accounting advice, or to address specific situations. Please consult with your legal or tax advisor to supplement and verify what you learn here. This is presented for informational or educational purposes only and does not constitute a recommendation to buy/sell any security investment or other product, nor is this an offer or a solicitation of an offer to buy/sell any security investment or other product. Any opinion or estimate constitutes that of the writer only, and is subject to change without notice. The above may contain information obtained from sources believed to be reliable. No guarantees are made about the accuracy or completeness of information provided. Past performance is no guarantee of future results. 

What Recent Financial Market Volatility Means for Investors

Avoid putting all your eggs in one basket is Investing 101. By investing in a variety of asset classes, such as stocks, bonds, and commodities, investors hope to earn a reasonable return over time and avoid sharp swings in the value of their portfolios. A common rule of thumb has been that equities go up when the economic outlook brightens while bonds do better when the clouds darken. Their low correlation to one another is why they tend to be paired up in portfolios.

After the 2007-2008 financial crisis, many central banks pursued policies that helped drive up asset values across markets, from equities, bonds, and real estate to alternative investments like art and exotic cars. Because these markets became more positively correlated with each other, many investment portfolios rose with the rising tide, even portfolios that were not well diversified.

But over the past few months, there has been a sharp decline in the correlation between different asset classes (see chart), taking the measure back to where it was before the 2007-2008 financial crisis. Rather than being closely linked, returns in different markets have lately become more divergent. If sustained, this suggests investors will once again need to be acutely focused on making sure their portfolios are properly diversified.  

A recent article in The Economist explains what may be behind this renewed urgency to focus on diversification:

“Now that central banks are no longer quite so supportive, it may be time for markets to go their separate ways. The actions of central banks swamped the economic fundamentals; those factors can now reassert themselves. In the first few weeks after Donald Trump’s victory in the presidential election, the value of global shares rose by $3 trillion and that of bonds fell by the same amount, according to Torsten Slok of Deutsche Bank. The Dow Jones Industrial Average passed 20,000 for the first time on January 25th. Emerging markets have underperformed American shares since Mr. Trump’s victory.

The rationale behind such differences is that tax cuts in America will improve economic growth (good for equities) but widen the budget deficit and push up inflation (bad for bonds). Mr. Trump’s threats of tariffs and border taxes will be good for domestically focused American companies, less so for businesses operating in developing countries.”    

How much diversification should an investor have in a portfolio? There is no single answer, because it depends on what they want to do with the money and their time horizon. With this in mind, investors should consider diversifying each of their asset “buckets.” For example, they could diversify their stock holdings by owning different amounts of large and small capitalization stocks, value and growth stocks, or mutual funds distributed across domestic and international stocks. For their “bond bucket”, investors could consider a variety of maturities and issuers (Treasuries, municipalities, and corporates), depending on market conditions and their own tax situation.


DISCLAIMER:  This information is not intended to provide legal or accounting advice, or to address specific situations. Please consult with your legal or tax advisor to supplement and verify what you learn here. This is presented for informational or educational purposes only and does not constitute a recommendation to buy/sell any security investment or other product, nor is this an offer or a solicitation of an offer to buy/sell any security investment or other product. Any opinion or estimate constitutes that of the writer only, and is subject to change without notice. The above may contain information obtained from sources believed to be reliable. No guarantees are made about the accuracy or completeness of information provided. Past performance is no guarantee of future results. 


The Key to Growth? Race with the Machines

Labor productivity in the United States, which measures the value of goods and services produced by one hour of labor (adjusted for inflation), has been on an upswing since the financial crisis. In the third quarter of 2015, for example, labor productivity in the nonfarm sector hit a new post-World War II record. Another measure of the health of an economy is real GDP per capita. It measures the total economic output of a country divided by the number of people (adjusted for inflation). Real GDP per capita in the United States hit a new all-time high of $51,473 in Q3 2016.

Despite these gains, there has been a decoupling of productivity from employment. Starting early in the last decade, growth in employment and wages lagged growth in productivity. Pundits and politicians have seized on this gap, frequently citing computer-aided automation, industrial robots, and machine learning as culprits behind slow employment growth. Many have catastrophized the role of technology and its likely future impact on jobs and wages.

For a more balanced and nuanced perspective on what is going on, watch a short talk by Erik Brynjolfsson, Director of the MIT Initiative on the Digital Economy and Professor at the MIT Sloan School of Business. He is the co-author of the New York Times best-seller The Second Machine Age: Work, Progress and Prosperity in a Time of Brilliant Technologies. In less than 12 minutes, he does a great job of framing the issues.


DISCLAIMER:  This information is not intended to provide legal or accounting advice, or to address specific situations. Please consult with your legal or tax advisor to supplement and verify what you learn here. This is presented for informational or educational purposes only and does not constitute a recommendation to buy/sell any security investment or other product, nor is this an offer or a solicitation of an offer to buy/sell any security investment or other product. Any opinion or estimate constitutes that of the writer only, and is subject to change without notice. The above may contain information obtained from sources believed to be reliable. No guarantees are made about the accuracy or completeness of information provided. Past performance is no guarantee of future results. 


Slicing the pie - U.S. most philanthropic country in the world

The Charities Aid Foundation recently published a report on charitable giving by individuals in 24 countries. Their analysis covered over half of the world’s population and 75 percent of the global economy.

The United States ranked first based on charitable giving by individuals expressed as a percent of Gross Domestic Product (GDP). The top 10 countries are shown below. The U.S. was almost twice as generous as the second ranked country, New Zealand. Generosity is not just a phenomenon restricted to Western economies, with South Korea, India, and Russia all being included in the top 10 list.

caharitable giving by individuals

The report also examined the relationship between generosity and the level of taxation and government spending. Strikingly, the authors of the report did not find any correlation between generosity and the overall tax burden, the top income tax rate, government expenditure as a percent of GDP, the corporation tax rate, average rate of employee social security charges, or the average income tax level.

They did find a correlation between charitable giving and other aspects of giving such as volunteering time and helping a stranger. Not surprisingly, countries where people are more willing to volunteer their time are also more likely to give monetarily to charities.


DISCLAIMER:  This information is not intended to provide legal or accounting advice, or to address specific situations. Please consult with your legal or tax advisor to supplement and verify what you learn here. This is presented for informational or educational purposes only and does not constitute a recommendation to buy/sell any security investment or other product, nor is this an offer or a solicitation of an offer to buy/sell any security investment or other product. Any opinion or estimate constitutes that of the writer only, and is subject to change without notice. The above may contain information obtained from sources believed to be reliable. No guarantees are made about the accuracy or completeness of information provided. Past performance is no guarantee of future results. 

Will the Federal Reserve Raise Interest Rates?

Financial markets are obsessed with trying to figure out whether the Federal Reserve will raise interest rates. Stock and bond markets rise and fall on rumors and indications of what the Fed will do. The Federal Reserve makes these decisions through a committee called the Federal Open Market Committee (FMOC). The 12 members of the FMOC meet 8 times a year to discuss and debate current economic conditions and the near-term outlook for economic growth, unemployment, and inflation.  Based upon these deliberations, the committee may elect to nudge interests rates higher or lower. The meetings of the committee, which are closed to the public, are the subject of intense pre-meeting speculation by Wall Street about potential Federal Reserve actions. To foster greater transparency, the Chair of the FOMC holds a press conference immediately after each meeting to update the market on their deliberations.

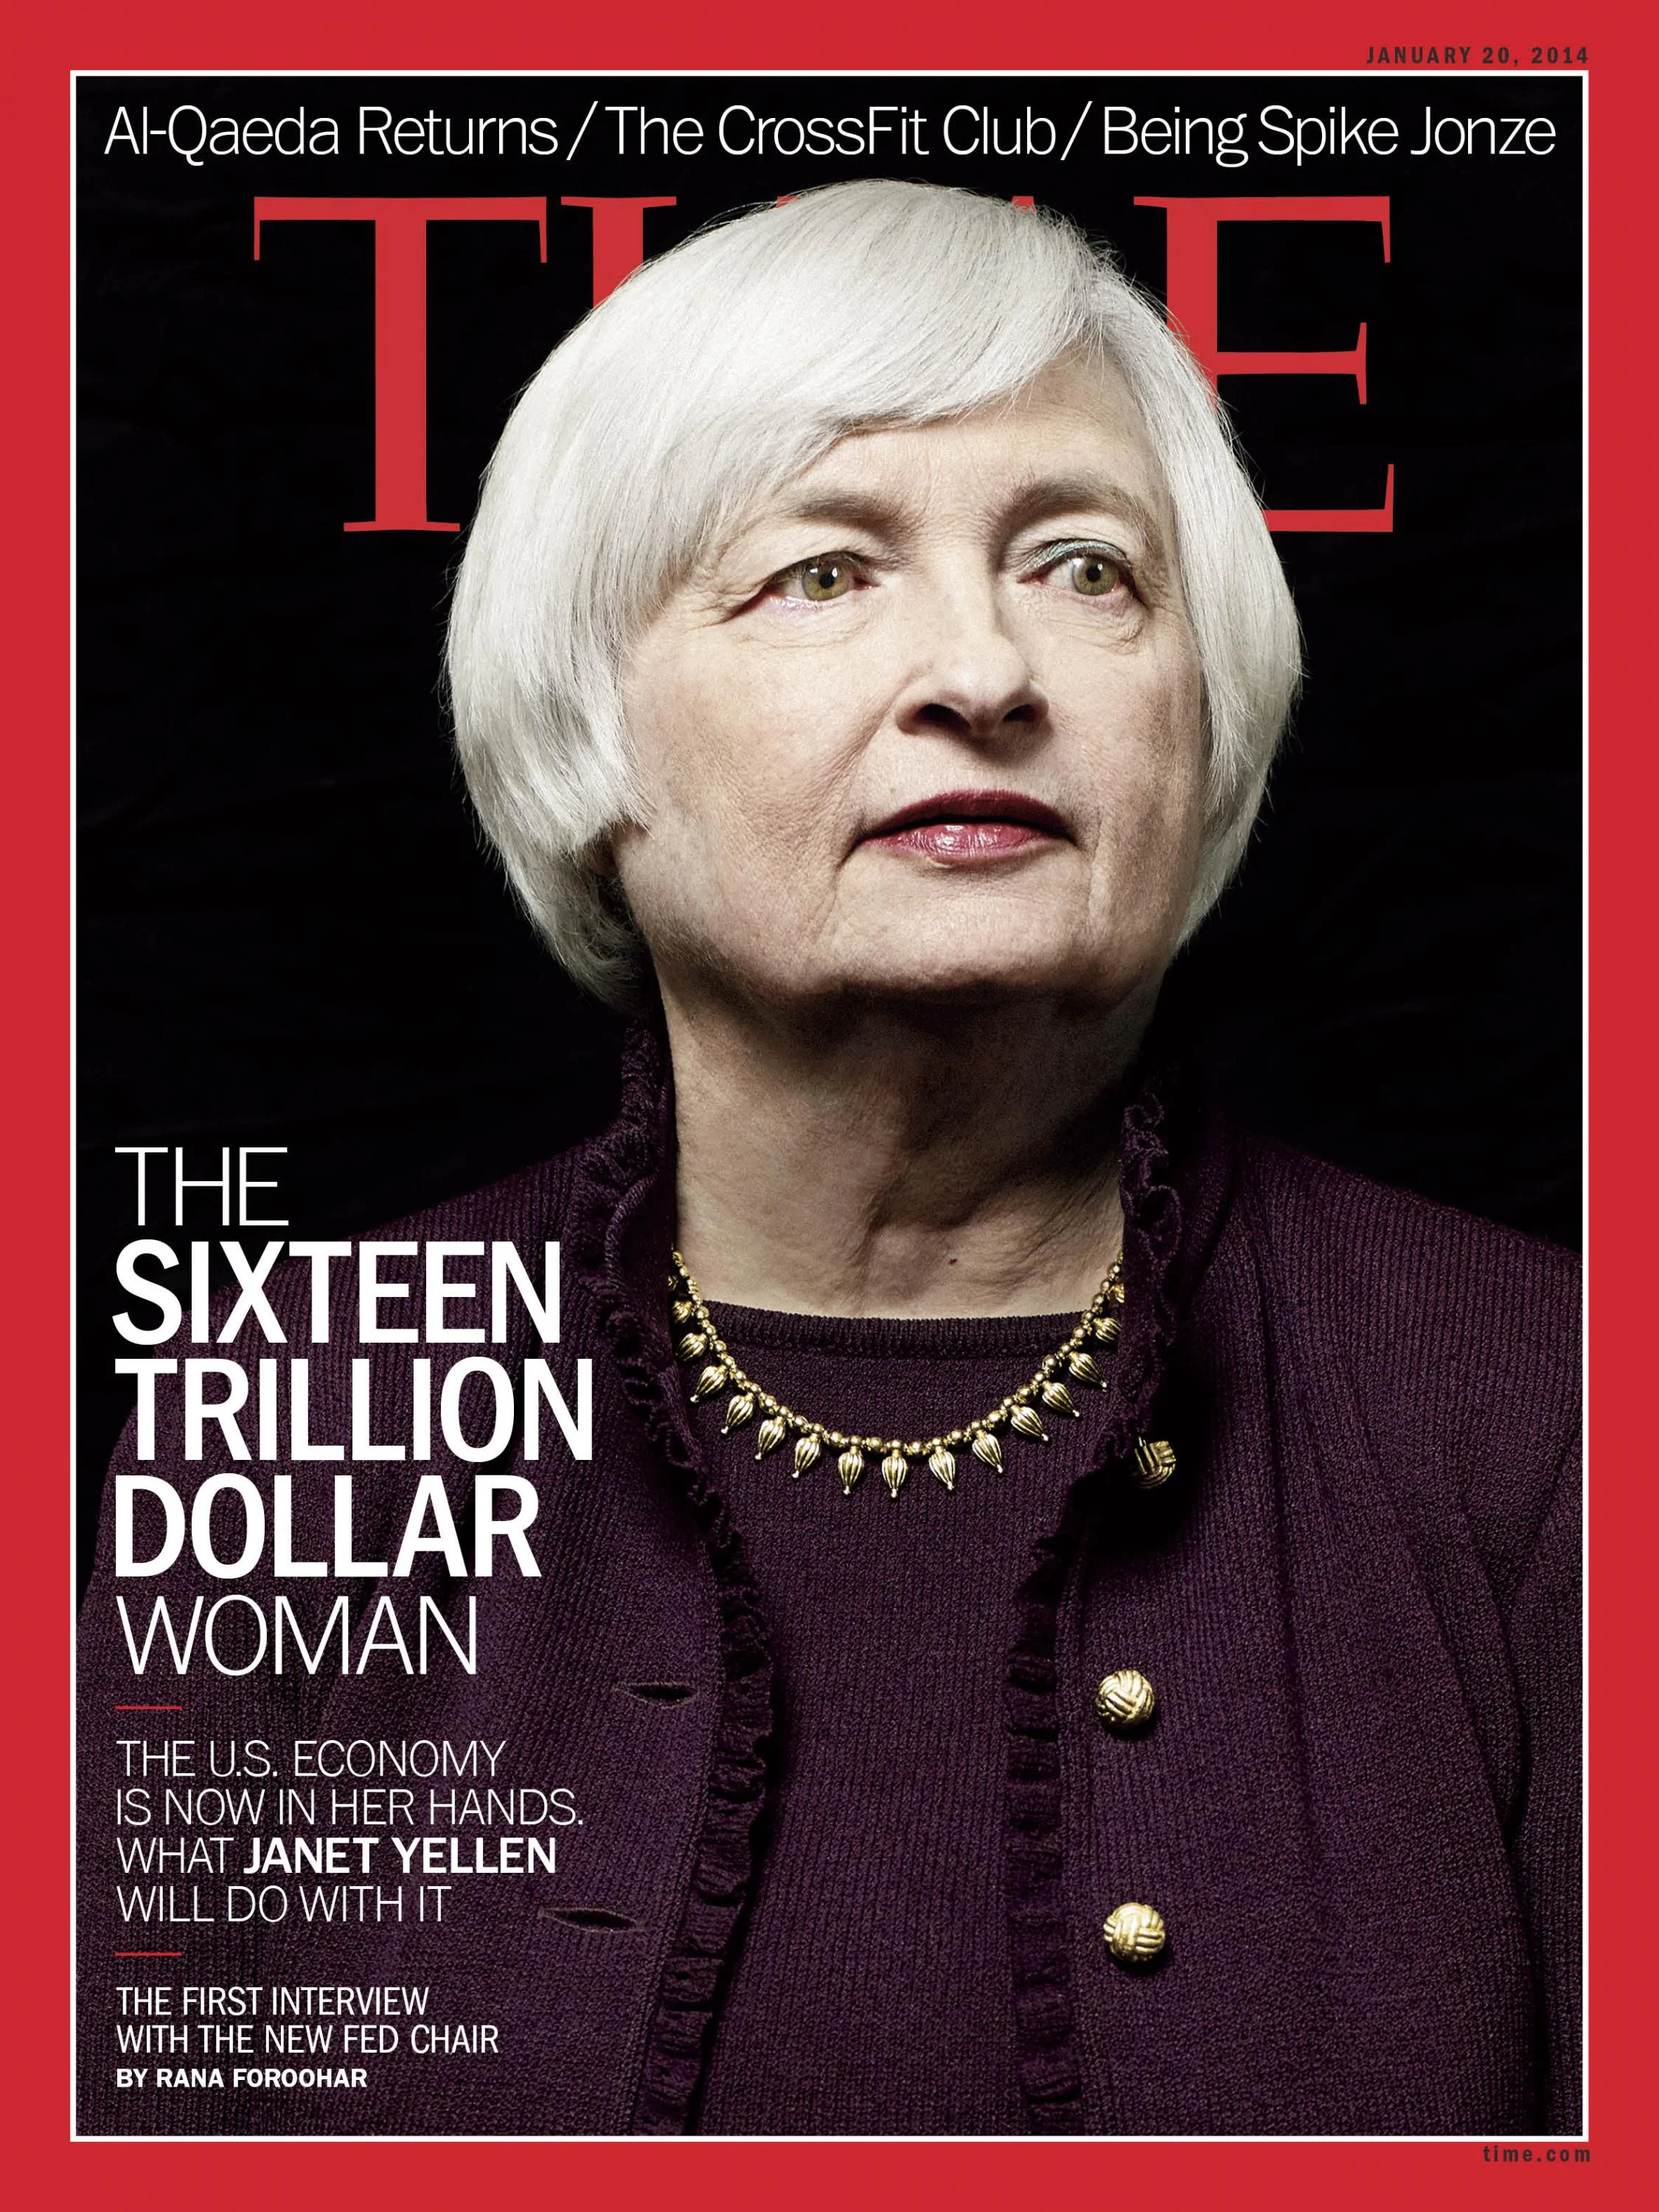
The FOMC met on September 21, 2016. Janet Yellen, the Chair of the FMOC and the most senior executive at the Federal Reserve, announced in the press conference that the Federal Reserve would not take action at this time to raise the federal funds rate, the interest rate the FOMC controls most directly. She also communicated that “We continue to expect that the evolution of the economy will warrant only gradual increases in the federal funds rate over time to achieve and maintain our objectives.”

Watch Yellen, a Brooklyn-born native who when to high school in Bay Ridge, deliver this message and take questions from the press.


DISCLAIMER:  This information is not intended to provide legal or accounting advice, or to address specific situations. Please consult with your legal or tax advisor to supplement and verify what you learn here. This is presented for informational or educational purposes only and does not constitute a recommendation to buy/sell any security investment or other product, nor is this an offer or a solicitation of an offer to buy/sell any security investment or other product. Any opinion or estimate constitutes that of the writer only, and is subject to change without notice. The above may contain information obtained from sources believed to be reliable. No guarantees are made about the accuracy or completeness of information provided. Past performance is no guarantee of future results. 

Rodney Dangerfield’s First Economics Class

Theory versus reality. Economists are regularly accused of way too much of the former, and not enough of the latter. Economic concepts have been taught and studied for over fifty years using ‘models’, simplified versions of reality. I love the bit that Rodney Dangerfield did on this theme in his 1986 movie Back to School. He plays a wealthy but uneducated father who goes to college to show solidarity with his disheartened son. Watch what happens when he goes to his first economics class.


DISCLAIMER:  This information is not intended to provide legal or accounting advice, or to address specific situations. Please consult with your legal or tax advisor to supplement and verify what you learn here. This is presented for informational or educational purposes only and does not constitute a recommendation to buy/sell any security investment or other product, nor is this an offer or a solicitation of an offer to buy/sell any security investment or other product. Any opinion or estimate constitutes that of the writer only, and is subject to change without notice. The above may contain information obtained from sources believed to be reliable. No guarantees are made about the accuracy or completeness of information provided. Past performance is no guarantee of future results. 

Why do economists find roads, bridges, and airports so sexy?

Finding cost-effective ways to stimulate long-term growth and employment in the economy without triggering inflation is the holy grail of macroeconomics. Many policy prescriptions, such as cutting marginal tax rates and eliminating deductions, tend to get bogged down in intense political debates that lead to muted reform or inaction.

But there is one policy prescription espoused by economists that now seems to have support from both sides of the political aisle: higher spending on critical infrastructure that supports the movement of people and goods. These types of investments tend to have two types of benefits. First are the direct benefits associated with the new jobs created to build the infrastructure and the multiplier effect of spending on concrete, steel, and construction jobs. But more importantly, these projects can help make the United States more competitive by eliminating delays, lowering costs, and speeding up innovation. 

The Port of Oakland, California is a great example of the role of infrastructure spending on job, as detailed in a recent New York Times article titled, Coming Soon, Economists Hope: Big Spending on Roads, Bridges and Ports.


http://www.nytimes.com/2016/09/19/business/economy/coming-soon-economists-hope-big-spending-on-roads-bridges-and-ports.html?smprod=nytcore-iphone&smid=nytcore-iphone-share&_r=0


DISCLAIMER:  This information is not intended to provide legal or accounting advice, or to address specific situations. Please consult with your legal or tax advisor to supplement and verify what you learn here. This is presented for informational or educational purposes only and does not constitute a recommendation to buy/sell any security investment or other product, nor is this an offer or a solicitation of an offer to buy/sell any security investment or other product. Any opinion or estimate constitutes that of the writer only, and is subject to change without notice. The above may contain information obtained from sources believed to be reliable. No guarantees are made about the accuracy or completeness of information provided. Past performance is no guarantee of future results.